Food
Effect of additive and drying on flour flowability using Granupack
This physical property can be measured by applying controlled taps to a powdery sample. The apparent density is then measured after each tap, building the compaction curve...
Principle
The Granupack instrument can be used to estimate the powder flow ability.
LEARN MORE ABOUT THE GRANUPACK
This physical property can be measured by applying controlled taps to a powdery sample. The apparent density is then measured after each tap, building the compaction curve. Then, a fit curve resulting from a physical law allows the extraction of the flowability index Tau, that may be directly related to the flow properties of the powder; low Tau values related to good flow properties. A complementary index, n1/2, kinetic parameter can also be obtained.
In addition to these parameters, the Hausner ratio can be calculated.
Sample Analysis
Two samples prepared under different drying processes have been characterized by the Granupack instrument.
LEARN MORE ABOUT THE GRANUPACK
The aim of this work is to observe their differences and to discriminate each sample. Figure 1 shows the evolution of the density versus the tap number for each sample. As we can see on this figure, the behavior of the samples can easily be distinguished without any ambiguity. Sample A shows the higher initial density and the sample B shows the lower one.
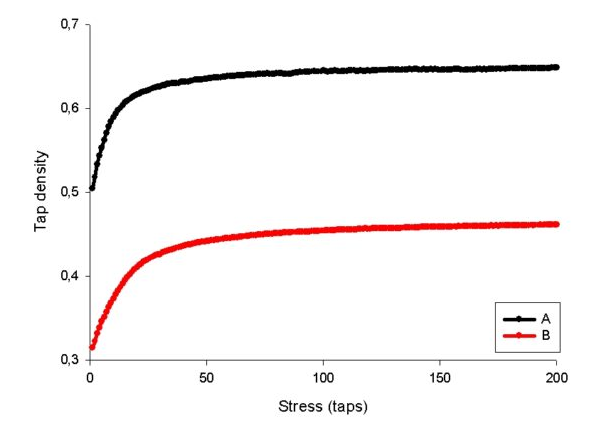
Figure 1: Flow curve in function of the stress applied to the sample
Figure 2 shows the kinetic curves for the different samples. We can see that sample A is characterized by a fast kinetic of diffusion than powder B. So, powder A reaches faster the maximum density than powder B. These results show the importance of the drying process on the physical behavior of the powders.
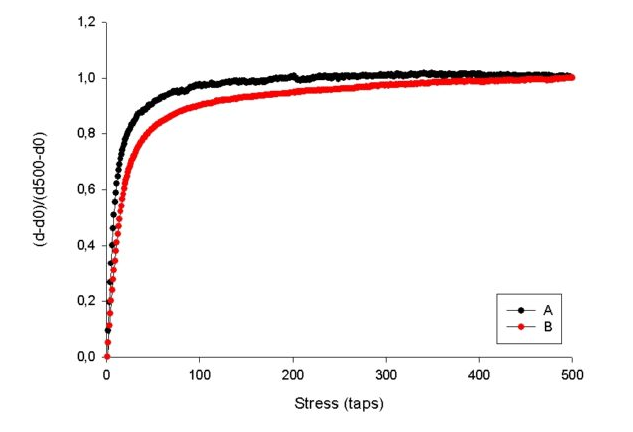
Figure 2: kinetic curves for the sample analyzed
To confirm these results, electronic microscopy has been performed on the powders A and B.
The figures 3 and 4 show the microphotographs of these powders. On these pictures, we can see major differences concerning the particle shape and surface between the two powders. As we can see on these figures, powder A is characterized by a smoother particle surface than the one of the particles of powder B. Moreover, for Sample A, the particles seem much denser. These observations can explain and confirm the difference in initial density and the results observed by using the GranuPack instrument.
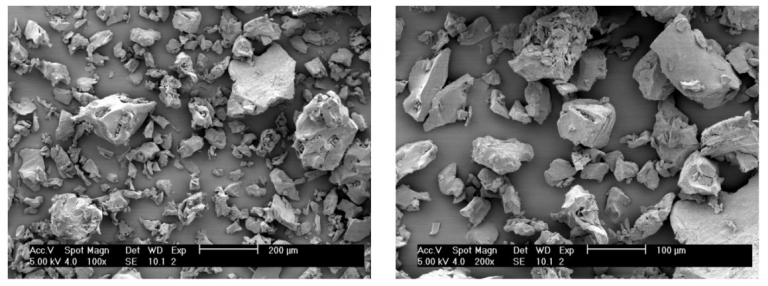
Figure 3: sample A particles observed by using an electronic microscope

LEARN MORE ABOUT THE GRANUPACK
Figure 4: sample B particles observed by using electronic microscope