Food
Flour flow properties modification by small particles addition
In this study, the physical behavior of a flour powder before (Powder A) and after (Powder A + filler) the addition of the small particles is analyzed by using the Granupack instrument.
Principle
In this study, the physical behavior of a flour powder before (Powder A) and after (Powder A + filler) the addition of the small particles is analyzed by usingthe GranuPack instrument.
LEARN MORE ABOUT THE GRANUPACK
Sample Analysis
Figure 1 shows the evolution of the apparent density versus the tap number for the two samples.
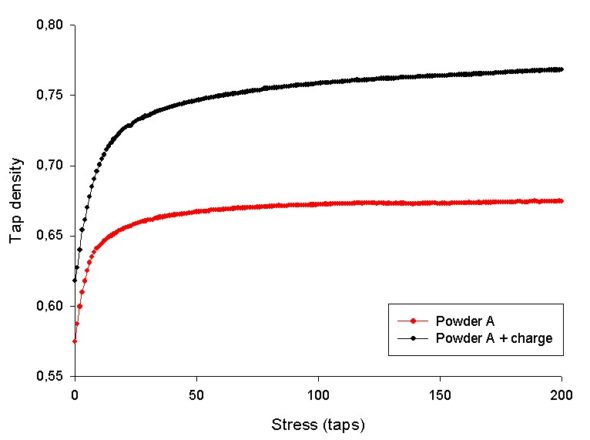
| Samples | d0 | d500 | dinfinite | Tau | n1/2 | Hausner Ratio |
| POWDER A | 0.574 | 0.677 | 0.7 | 4.2 | 5.2 | 1.18 |
| POWDER A + FILLER | 0.618 | 0.779 | 0.818 | 10.1 | 9.5 | 1.26 |
Table 1 : specific curve parameters for each powder
These results clearly indicate that the addition of small particles strongly modifies the physical powder behavior.
Indeed, the powder without small particles is characterized by a lower initial bulk density and a lowest density variation during the measurement (0.574 and 0.618 respectively).
This behavior is confirmed in table 1 which gives some specific curve parameters for each powder.
By analyzing the flowability index and the kinetic parameter n1/2, we can conclude that the powder without small particles is characterized by the best flow-ability.
LEARN MORE ABOUT THE GRANUPACK
By considering ESEM analysis (see figures 2 and 3), we can observe that the particles of the powder without fillers show more smooth and regular surface than the powder with the filler.
Indeed, the small particles physico-chemically adsorbed on the spherical particles, biggest, (see figure 3) modify the surface state which alter the flowability of the powders.
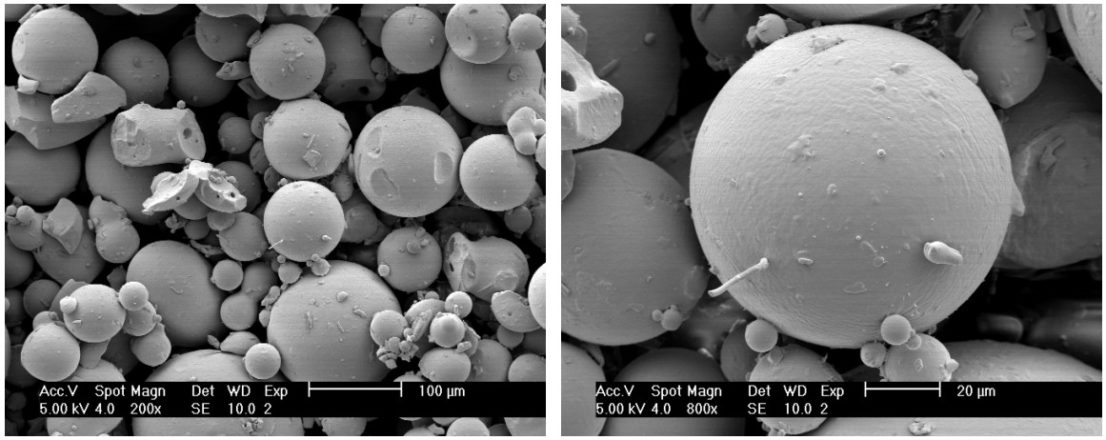
Figure 2 : electron micrographs of powder A without filler
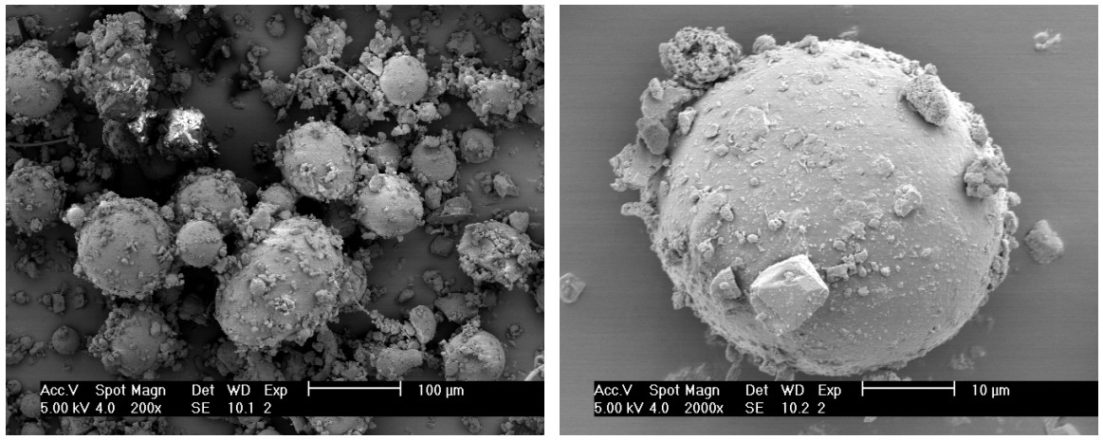
Figure 3 : electron micrographs of powder A with filler
In order to analyze the compaction dynamics in more details, the curves have been rescaled.
Figure 4 and 5 respectively show the evolution of the Hausner ratio value (d/d0) and the compaction kinetic versus the stress (taps) applied to the powders. The difference observed regarding the initial density for powder without (Powder A) and with fillers (Powder A + Filler) can be explained by the width of the particle size distribution. The small particles brought by the filler can take place in the voids present between the biggest particles increasing by this way the initial density (see table 1 and figure 1).
Subsequently, under the applied stress (taps) and by the voids, small particles can move through the pile given higher Hausner ratios (figure 4) than the sample without filler.
LEARN MORE ABOUT THE GRANUPACK
It is also interesting to note that the first taps seem to be the most important ones in the organization and the mechanism of compaction: the compaction kinetic being very fast at the beginning of the measurement. A plateau of relative density is rapidly reached (figure 4 and 5). In our example, it seems that the sample without filler is more sensitive to the first taps than the sample with fillers.
So, less taps are required to reach the plateau of maximum density for the powder without the filler. This behavior is due to the absence of small particles which can percolate through the pile of coarse particles.
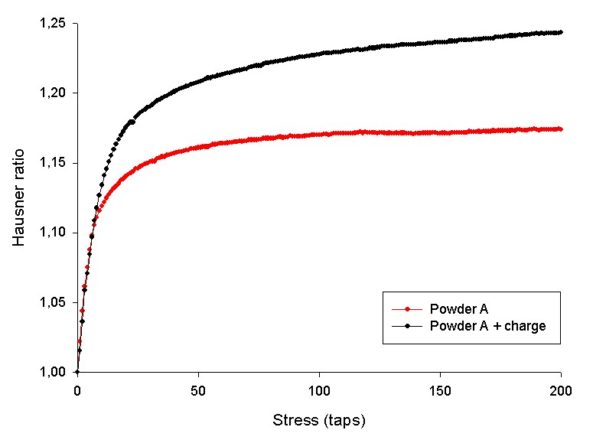
Figure 4 : Hausner ratio curves for sample with and without filler
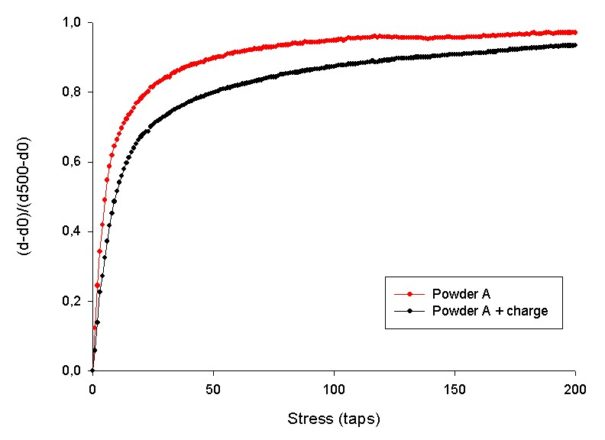
Figure 5 : kinetic of compaction curves for sample with and without filler