Additive manufacturing
Influence of Particle Size Distribution On Metallic Powders Spreadability and Triboelectricity
A range of measurement methods has been developed to cover all the needs of industries processing powders and granular materials...


Introduction
Generalities
Granular materials and fine powders are widely used in industrial applications. To control and to optimize processing methods, these materials have to be precisely characterized. The characterization methods are related either to the properties of the grains (granulometry, morphology, chemical composition, …) and to the behaviour of the bulk powder (flowability, density, blend stability, electrostatic properties, …).
However, concerning the physical behaviour of bulk powder, most of the techniques used in R&D or quality control laboratories are based on old measurement techniques.
During the last decade, we have updated these techniques to meet the present requirements of R&D laboratories and production departments. In particular, the measurement processes have been automatized and rigorous initialization methods have been developed to obtain reproducible and interpretable results. Moreover, the use of image analysis techniques improves the measurements precision.
A range of measurement methods has been developed to cover all the needs of industries processing powders and granular materials. However, in this application only the GranuDrum and GranuCharge instruments will be presented:
- GranuDrum to measure flowing properties (Flowing angle, dynamic cohesive index, first avalanche angle and powder aeration);
- GranuCharge to measure powder electrostatic properties.
GranuDrum
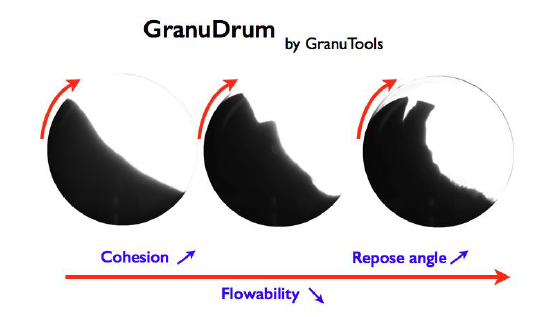
The GranuDrum instrument is an automated powder flowability measurement method based on the rotating drum principle.
A horizontal cylinder with transparent sidewalls called drum is half filled with the sample of powder. The drum rotates around its axis at an angular velocity ranging from 2 rpm to 60 rpm. A CCD camera takes snapshots (30 to 100 images separated by 1s) for each angular velocity. The air/powder interface is detected on each snapshot with an edge detection algorithm.
Afterwards, the average interface position and the fluctuations around this average position are computed. Then, for each rotating speed, the flowing angle (also known in the literature as ‘dynamic angle of repose’) αf is computed from the average interface position and the dynamic cohesive index σf is measured from the interface fluctuations.
LEARN MORE ABOUT THE GRANUDRUM
In general, a low value of the flowing angle αf corresponds to a good flowability. The flowing angle is influenced by a wide set of parameters: the friction between the grains, the shape of the grains, the cohesive forces (van der Waals, electrostatic and capillary forces) between the grains. The dynamic cohesive index σf is only related to the cohesive forces between the grains. A cohesive powder leads to an intermitted flow while a non-cohesive powder leads to a regular flow. Therefore, a dynamic cohesive index closes to zero corresponds to a non-cohesive powder. When the powder cohesiveness increases, the cohesive index increases accordingly.
In addition to the measurement of both the cohesive index σf and the flowing angle αf as a function of the rotating speed, the GranuDrum allows to measure the first avalanche angle and the powder aeration during the flow.
GranuPack
The bulk density, the tapped density and the Hausner ratio measurement (commonly named “taptap test”) is very popular for powder characterization because of both the simplicity and the rapidity of the measurement. Moreover, the density and the ability of a powder to increase its density are important parameters for storage, transportation, caking, etc. The recommended procedure is defined in the pharmacopeia.
This simple test has three major drawbacks. First, the result of the measurement depends on the operator. Indeed, the filling method influences the initial powder volume. Secondly, the volume measurements by naked eyes induce strong errors on the results. Finally, with this simple method, we completely miss the compaction dynamics between the initial and the final measurements.
The GranuPack instrument is an automated and improved tapped density measurement method based on recent fundamental research results. The behaviour of the powder submitted to successive taps is analysed with an automatized device. The Hausner ratio Hr, the initial density ρ(0) and the final density after n taps ρ(n) are measured precisely. The tap number is commonly fixed at n=500. Moreover, a dynamical parameter n1/2 and an extrapolation of the maximum density ρ(∞) are extracted from compaction curves. Additional indexes can be used but they are not presented in this report. The powder is placed in a metallic tube with a rigorous automated initialization process.
LEARN MORE ABOUT THE GRANUPACK
Afterwards, a light hollow cylinder is placed on the top of the powder bed to keep the powder/air interface flat during the compaction process. The tube containing the powder sample rose up to a fixed height of ΔZ and performs free falls. The free fall height is generally fixed to ΔZ = 1mm or ΔZ = 3mm. The height h of the powder bed is measured automatically after each tap. From the height h, the volume V of the pile is computed. As the powder mass m is known, the density ρ is evaluated and plotted after each tap. The density is the ratio between the mass m and the powder bed volume V.
With the GranuPack method, the results are reproducible with a small quantity of powder (typically 35 ml). The Hausner ratio Hr is related to the compaction ratio and is calculated by the equation Hr = ρ(500) / ρ(0) , where ρ(0) is the initial bulk density and ρ(500) the tapped density computed obtained after 500 taps.
GranuCharge
Electrostatic charges are created inside a powder during a flow. This apparition of electric charges is due to the triboelectric effect, which is a charge exchange at the contact between two solids. During the flow of a powder inside a device (mixer, silo, conveyor, …), the triboelectric effect takes place at the contact between the grains and at the contact between the grains and the device. Therefore, the characteristics of the powder and the nature of the material used to build the device are important parameters.
LEARN MORE ABOUT THE GRANUCHARGE
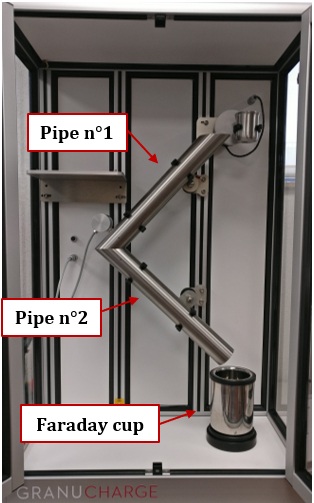
The GranuCharge instrument automatically and precisely measures the quantity of electrostatic charges created inside a powder during a flow in contact with a selected material. The powder sample flows inside a vibrating V-tube and fall in a Faraday cup connected to an electrometer. The electrometer measures the charge acquired by the powder during the flow inside the V-tube.
In order to obtain reproducible results, a rotating or a vibrating device is used to feed the V-tube regularly.
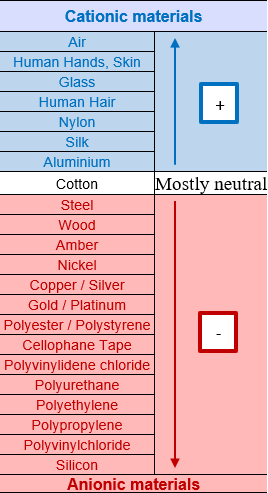
The triboelectric effect is a result in one object gaining electrons on its surface, and therefore becoming negatively charged, and another object losing electrons, thus, becoming positively charged. Which material becomes negative and which becomes positive depend on the relative tendencies of the materials involved to gain or lose electrons. Some materials have a greater tendency to gain electrons than others, in the same manner that others tend to lose electrons easier.
To represent these trends, the triboelectric series was developed (Table 1). It lists materials with tendency to charge positively and others with tendency to charge negatively. In the middle of the table are listed materials that do not show tendency to behave either way. However, this table only gives information about materials charging behaviour tendency. This is for this reason that the GranuCharge was developed: to give precise numerical values about powders charging behaviour.
Selected Powders
Powders Description
Two bronze powders were selected for this study, they are called sample A and B:
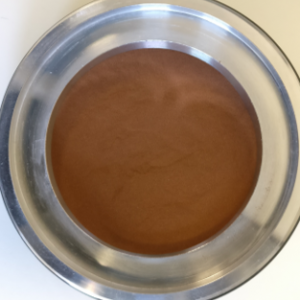
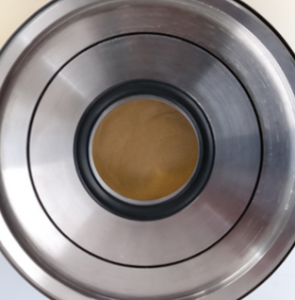
All powders are orange / brown in colour and sample A is darker than sample B.
No bag of silica gel was found inside the powders boxes to avoid humidity effect.
Particle size distribution and shape analysis
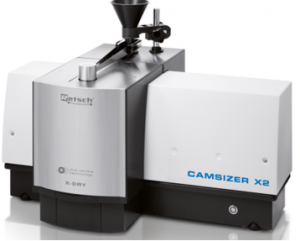
The Particles Size Distribution (PSD) and shape characterisation analysis and characterisation were carried out by the CAMSIZER X2 instrument. This instrument is a powerful, extremely versatile particle analyser with a wide measuring range that combines state-of-the-art camera technology with flexible dispersion options. Based on the principle of Dynamic Image Analysis, the CAMSIZER X2 provides precise particle size and shape information of powders, granules and suspensions in a measuring range from 0.8μm to 8mm.
LEARN MORE ABOUT THE GRANUCHARGE
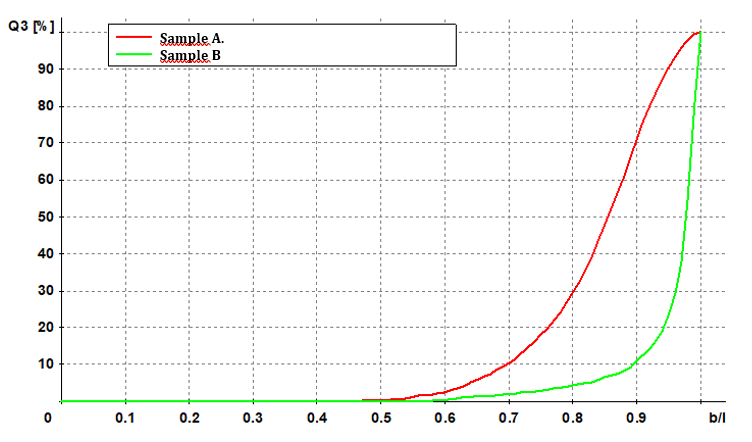
The previous figure allows to conclude about particles sphericity. Indeed, with 30% of particles above 0.95, we can see that sample B is mostly composed of spherical particles. Nonetheless, with 95% of particles bellow 0.95, sample A particles shape is more “chaotic”.
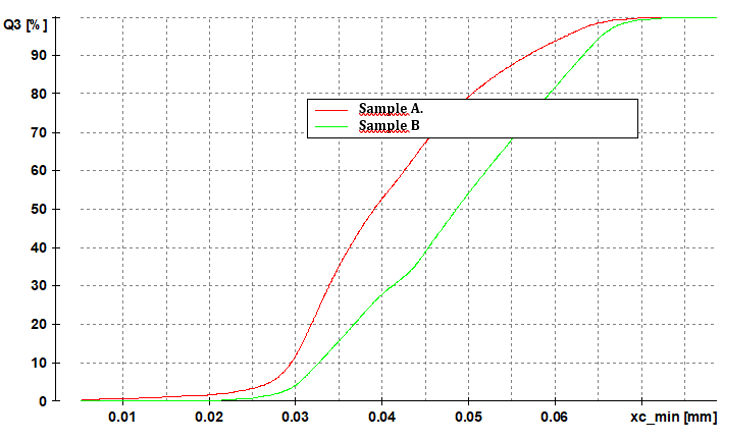
This particle size distribution is interesting, because it allows to conclude that sample B (with a d50 close to 48μm) is coarser than sample A (d50 close to 38μm).
Preliminary observations highlighted that the samples flowabilities in quasi-static conditions are nearly the same. To prove these assumptions, three GranuTools instruments will be used during this study: the GranuPack (tapped density), the GranuDrum (rheometer for powder) and the GranuCharge (triboelectric effect measurements).
GranuPack Analysis
Experimental protocol
For each experiment with the GranuPack, 1000 taps were applied to the sample with a tap frequency of 1Hz and the measurement cell free-fall was 1 mm (∝ tap energy). Before an experiment, air temperature and hygrometry are recorded. Some samples were analyzed two times. The main purpose is to prove the high accuracy of the GranuPack instrument and to highlight the ageing of powders and its impact on their flowability.
LEARN MORE ABOUT THE GRANUPACK
Experimental Data
The powder mass is recorded before each experiment. The sample is poured inside the measurement cell by following the software instructions (i.e. without user dependency). Powders bulk densities were investigated under the same moisture conditions (45% RH and 21°C).
Figure 7 represents the full compaction curves, which is the bulk density (ρ(n)) versus the number of taps. The error bars have been displayed but they are too small to be visible (bulk density error is close to 0.4%).
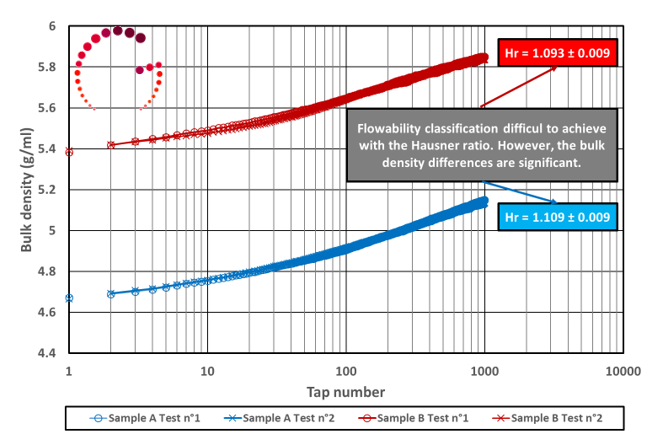
The full results are described by Table 2 where ρ(0) is the initial bulk density (in g/mL), ρ(500) the bulk density after 500 taps (g/mL). ρ(∞) is the optimal bulk density (in g/mL), it is calculated by a model available in the GranuPack software and predicts the minimum density achievable by the tapping test. Hr and Cr are the Hausner and Carr ratios, n1/2 and τ are two parameters linked to the compaction kinetic
| Sample Name | p(0) (g/mL) | p(500) (g/mL) | n1/2 | Hr | Cr | p(∞) (g/mL) | τ |
|---|---|---|---|---|---|---|---|
| Sample A Test n°1 | 4.643 | 5.149 | 87.8 | 1.109 | 9.8 | 5.400 | 153.3 |
| Sample A Test n°2 | 4.633 | 5.137 | 71.3 | 1.109 | 9.8 | 5.370 | 130.9 |
| Sample B Test n°1 | 5.339 | 5.851 | 53.9 | 1.096 | 8.7 | 6.055 | 89.2 |
| Sample B Test n°2 | 5.353 | 5.836 | 62.6 | 1.090 | 8.3 | 6.033 | 94.1 |
Results interpretation
Regarding the initial bulk densities, we can see that these samples are highly different. Indeed, sample A bulk density is closed to 4.638g/ml, while it is equal to 5.360g/ml for sample B. For the tapped densities (after 1000 taps) the trends are the same, i.e. sample A tapped density (5.144g/ml) is lower than sample B (5.844g/ml). For the compaction dynamic (n1/2 parameter) we can deduce that the compaction is faster for sample B (average n1/2 = 58.25) than sample A (average n1/2 =79.47).
However, the preliminary observations regarding the flowability are confirmed with the Hausner ratio, regarding the measurement accuracy (0.8% on the Hausner ratio) we can see that the products flowabilities are similar (Hr close to 1.100).
GranuDrum Analysis
Experimental Protocol
For an experiment with the GranuDrum, powders were poured inside the measuring cell just after box opening. The quantity of powder used was approximately 50ml. Every powder was analysed under standard conditions (45%RH and 22°C). Twenty GranuDrum velocities were investigated (from 2 to 60rpm) and for each velocity, 40 pictures were taken to increase the accuracy/repeatability of measurement.
LEARN MORE ABOUT THE GRANUDRUM
Experimental Results
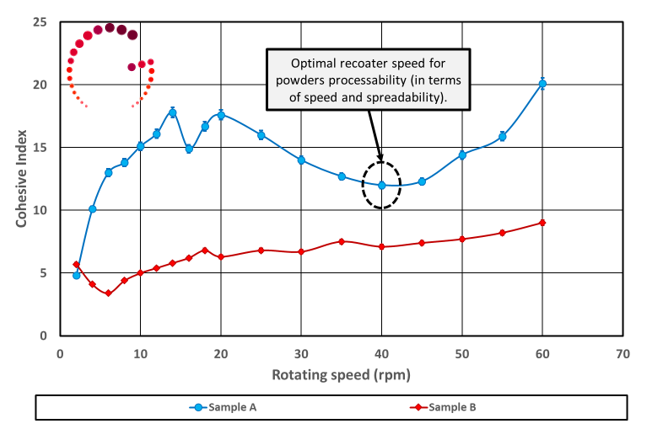
Figure 8 represents the Cohesive Index and the dynamic angle of repose as a function of the GranuDrum rotating speed. All presented measurements were performed by increasing the Drum speed and then by decreasing it (the main purpose of this step is to highlight a granulation phenomenon, i.e. a thixotropic behaviour). The Cohesive Index is linked to the fluctuations of the interface (powder/air) position, and it only represents the three contact forces. Thus, the Cohesive Index quantify powder spreadability.
Results Interpretation
First of all, if we look at a low velocity (2rpm), we can see that the powders flowability classification is difficult to achieve. This observation confirms the GranuPack conclusions (with the Hausner ratio). However, when the drum speed is increasing, the products characterisation can be achieved easily.
Sample B shows a shear-thickening behaviour, in other words, its spreadability is decreasing, when the shear stress applied is getting more and more important. This fact is probably due to its spherical shape. However, the maximum measured Cohesive Index is close to 8 at 60rpm, therefore, the product spreadability is excellent over the whole velocity range.
Since, the particle size distribution is inversely proportional to flowability, these observations are in good compliance with particles characterisation previously described. Sample A behaviour is more complex, indeed, between 2 to 16rpm, a shear-thickening trend is highlighted, then between 16 to 40rpm, the powder spreadability is increasing.
LEARN MORE ABOUT THE GRANUPACK
Finally, above 40rpm, another shear-thickening behaviour is measured, resulting in a diminution is the powder spreadability. This complex behaviour may be link to the particles shape which is far away from a sphere. Finally, due to its lower particle shape distribution (in comparison with sample B), this product highlights a lower flowability/spreadability.
These results are highly interesting, especially for sample A, indeed, the GranuDrum measurements allow us to define an optimal recoater, i.e., to achieve the optimal spreadability at the optimal process speed. This value is close to 40rpm, and thus to 170mm/s. On addition, observations made on powders cohesive index at low speed (i.e. 2rpm) are in good compliance with visual thoughts and GranuPack data interpretations.
GranuCharge Analysis
Experimental Control
The triboelectric effect of the powders was investigated with the help of GranuCharge instrument. For each experiment with the GranuCharge, Aluminium / Stainless-Steel 316L pipes and vibrating feeder were used:
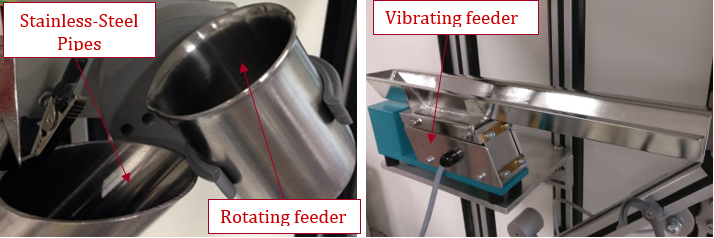
The quantity of powder used for each measurement was 25mL and the powder was not reused after a measurement. All powders were analysed under standard conditions (50%RH and 21°C).
LEARN MORE ABOUT THE GRANUCHARGE
At the beginning of the test, the initial powder charge density (qi, in nC/g) is measured by introducing powder inside the Faraday cup. Once this step is completed, the powder is poured inside the rotating feeder, and then the experiment starts. The final charge density is measured at the end of experiment (qf, nC/g).
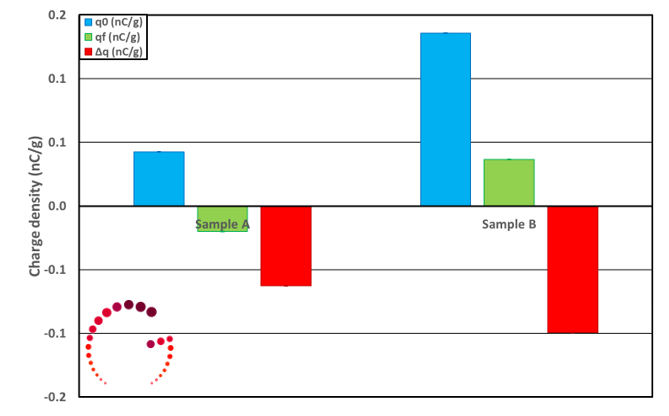
Table 3 summarizes all the results obtained with the GranuCharge instrument in nC/g and % lost is the percentage of particles trapped in the GranuCharge pipes:
| style="text-align: center;">Powders | q0 (nC/g) | qf (nC/g) | ∆q (nC/g) | % Lost |
|---|---|---|---|---|
| Sample A | 0.042 | -0.020 | -0.063 | 0.1 |
| Sample B | 0.136 | 0.036 | -0.099 | 0.1 |
Results Interpretation
Regarding initial charge measurements, we can see that sample B (q0 = 0.136nC/g) is more charged than sample A (q0 = 0.042nC/g). Additionally, after a flow in contact with Stainless-Steel 316L pipes, the trends are the same, in other words, the electrical charges build up is higher for sample B (Δq = -0.099nC/g) than sample A (Δq = -0.063nC/g).
Moreover, all the powders are cationic (initially positively charged) but they acquire a negative amount of charges when they flow inside Stainless-Steel 316L pipes. The higher amount of charges build-up for sample B (in comparison with sample A) may also be due to particle size distribution. Indeed, a lower particle size distribution means a higher specific area and consequently more friction between particles and pipes surface during a flow.
Conclusion
During this study, two samples were selected, they were bronze powders, on with big particle size and spherical shape and the other one with smaller particles and non-spherical shape. However, despite these differences, it was impossible to conclude about powder flowability in quasi-static conditions. These observations were confirmed by the GranuDrum and GranuPack instruments because the products highlight similar Hausner ratio and Cohesive Index (at 2 rpm) values. Nonetheless, working at higher speeds, several differences were observed:
- ✓ Smallest particle size distribution shows the lower Cohesive Index, and consequently the best spreadability. In addition, due to the spherical shape a shear-thickening behaviour is highlighted.
- ✓ Biggest particle size distribution has the lowest spreadability (due to its highest Cohesive Index) and also a complex rheological behaviour due to its non-spherical shape.
References
Cascade of granular flows for characterizing segregation, G. Lumay, F. Boschin, R. Cloots, N. Vandewalle, Powder Technology 234, 32-36 (2013).
Combined effect of moisture and electrostatic charges on powder flow, A. Rescaglio, J. Schockmel, N. Vandewalle and G. Lumay, EPJ Web of Conferences 140, 13009 (2017).
Compaction dynamics of a magnetized powder, G. Lumay, S. Dorbolo and N. Vandewalle, Physical Review E 80, 041302 (2009).
Compaction of anisotropic granular materials: Experiments and simulations, G. Lumay and N. Vandewalle, Physical Review E 70, 051314 (2004).
Compaction Dynamics of Wet Granular Assemblies, J. E. Fiscina, G. Lumay, F. Ludewig and N. Vandewalle, Physical Review Letters 105, 048001 (2010).
Effect of an electric field on an intermittent granular flow, E. Mersch, G. Lumay, F. Boschini, and N. Vandewalle, Physical Review E 81, 041309 (2010).
Effect of relative air humidity on the flowability of lactose powders, G. Lumay, K. Traina, F. Boschini, V. Delaval, A. Rescaglio, R. Cloots and N. Vandewalle, Journal of Drug Delivery Science and Technology 35, 207-212 (2016).
Experimental Study of Granular Compaction Dynamics at Different Scales: Grain Mobility, Hexagonal Domains, and Packing Fraction, G. Lumay and N. Vandewalle, Physical Review Letters 95, 028002 (2005).
Flow abilities of powders and granular materials evidenced from dynamical tap density measurement, K. Traina, R. Cloots, S. Bontempi, G. Lumay, N. Vandewalle and F. Boschini, Powder Technology, 235, 842-852 (2013).
Flow of magnetized grains in a rotating drum, G. Lumay and N. Vandewalle, Physical Review E 82, 040301(R) (2010).
How tribo-electric charges modify powder flowability, A. Rescaglio, J. Schockmel, F. Francqui, N. Vandewalle, and G. Lumay, Annual Transactions of The Nordic Rheology Society 25, 17-21 (2016).
Influence of cohesives forces on the macroscopic properties of granular assemblies, G. Lumay, J. Fiscina, F. Ludewig and N. Vandewalle, AIP Conference Proceedings 1542, 995 (2013).
Linking compaction dynamics to the flow properties of powders, G. Lumay, N. Vandewalle, C. Bodson, L. Delattre and O. Gerasimov, Applied Physics Letters 89, 093505 (2006).
Linking flowability and granulometry of lactose powders, F. Boschini, V. Delaval, K. Traina, N. Vandewalle, and G. Lumay, International Journal of Pharmaceutics 494, 312–320 (2015).
Measuring the flowing properties of powders and grains, G. Lumay, F. Boschini, K. Traina, S. Bontempi, J.-C. Remy, R. Cloots, and N. Vandewalle, Powder Technology 224, 19-27 (2012).
Motion of carbon nanotubes in a rotating drum: The dynamic angle of repose and a bed behavior diagram, S. L. Pirard, G. Lumay, N. Vandewalle, J-P. Pirard, Chemical Engineering Journal 146, 143-147 (2009).
Mullite coatings on ceramic substrates: Stabilisation of Al2O3–SiO2 suspensions for spray drying of composite granules suitable for reactive plasma spraying, A. Schrijnemakers, S. André, G. Lumay, N. Vandewalle, F. Boschini, R. Cloots and B. Vertruyen, Journal of the European Ceramic Society 29, 2169–2175 (2009).
Rheological behavior of β-Ti and NiTi powders produced by atomization for SLM production of open porous orthopedic implants, G. Yablokova, M. Speirs, J. Van Humbeeck, J.-P. Kruth, J. Schrooten, R. Cloots, F. Boschini, G. Lumay, J. Luyten, Powder Technology 283, 199–209 (2015).
The flow rate of granular materials through an orifice, C. Mankoc, A. Janda, R. Arévalo, J. M. Pastor, I. Zuriguel, A. Garcimartín and D. Maza, Granular Matter 9, p407–414 (2007).
The influence of grain shape, friction and cohesion on granular compaction dynamics, N. Vandewalle, G. Lumay, O. Gerasimov and F. Ludewig, The European Physical Journal E (2007).